
As the global economy continues to put the Covid-19 slump behind it, the market for electronic devices and an...
Is Global Trade in Quarantine?
The outbreak and spread of the Coronavirus disease (COVID-19) has stoked global fear of a pandemic. Disruptions to business in China and other affected countries are rising as are worldwide disruptions to travel and trade as countries scramble to put safeguards in place to stem the spread of the virus.
For companies with overseas operations and business, this latest public health crisis underscores the importance of planning for the unexpected, including an annual comprehensive assessment to properly mitigate the risk of doing business overseas where situations can change quite rapidly.
Like earlier epidemics such as SARS in 2002-2003 and the Ebola outbreak of 2014-2016, efforts to contain transmissions involve a range of decisions to quarantine the sick and minimize human-to-human contact. This proves particularly difficult in a global economy in which the flow of goods and people are both commonplace and vital, even in areas of the world seen as remote or rural. Outbreaks raise public concerns and even outright fear in both nearby countries and worldwide, and can lead to political decisions in non-crisis countries to suspend travel or block the transport of some or all goods. These actions are often sudden and unforeseen, with reaching consequences for complex supply chains.
Stories of the economic impact of Coronavirus are developing. At present, the disease remains mostly centered in China and that country is expected to see the most drastic economic impact. Already analysts are predicting both a significant first-quarter economic slowdown and an overall GDP decline for 2020 as many businesses remain closed or people remain at home, especially in the auto-manufacturing hub of Wuhan at the center of the crisis. With China’s economy already cooling, (GDP fell to 6.1% in 2019 from 6.6% in 2018) it remains to be seen what the impact will be on China’s export-driven growth, particularly electronics exports or its $280 billion per year textile exports.
Companies doing business in China are in a scramble to adjust their operations and specific industries are noting shocks. American exporters of agricultural products and machinery are already feeling the effects of the slowdown, as China struggles to keep food supply chains open in the face of quarantines and declining consumption. West Coast port traffic is already reporting a significant decline in traffic. Other notable examples include the cruise ship industry and tourism in general, beset by virus outbreaks on ships and growing travel restrictions. In addition, the luxury goods industry, which enjoys popularity among wealthier Chinese consumers and tourists, is projecting a $40 billion decline in sales in 2020.
The Coronavirus outbreak highlights the need for international companies to engage in a range of contingency planning to anticipate how to adapt business operations in the face of risks such as public health crises, natural disasters, energy shortages, slow or broken lines of communication and political risk. An entire field of business continuity planning encourages companies to regularly assess operational and financial risk by actively planning and developing working contingency plans. Proper insurance coverage, just one aspect of this, is crucial so that cash flows and financial obligations can be protected, even in the case of unforeseen breaks in trade.
Since 2004, Securitas Global Risk Solutions (“Securitas”) has helped clients across the United States develop trade credit and political risk transfer solutions that protect businesses from buyer non-payment and geo-political risks. As a specialty independent brokerage, Securitas is focused on developing comprehensive solutions that meet the needs of their client.
Recommended News

Lithium Market Set to Boom – A Risk Focus on the Lithium Triangle

Expropriation Risk in Mexico’s Oil Industry
Expropriation should always be a consideration for any business with overseas operations and investments....

Vodafone Arbitration Victory a Reminder to Consider Political Risk
In a recent, little-publicized international arbitration decision, an intergovernmental dispute resolution body ruled...
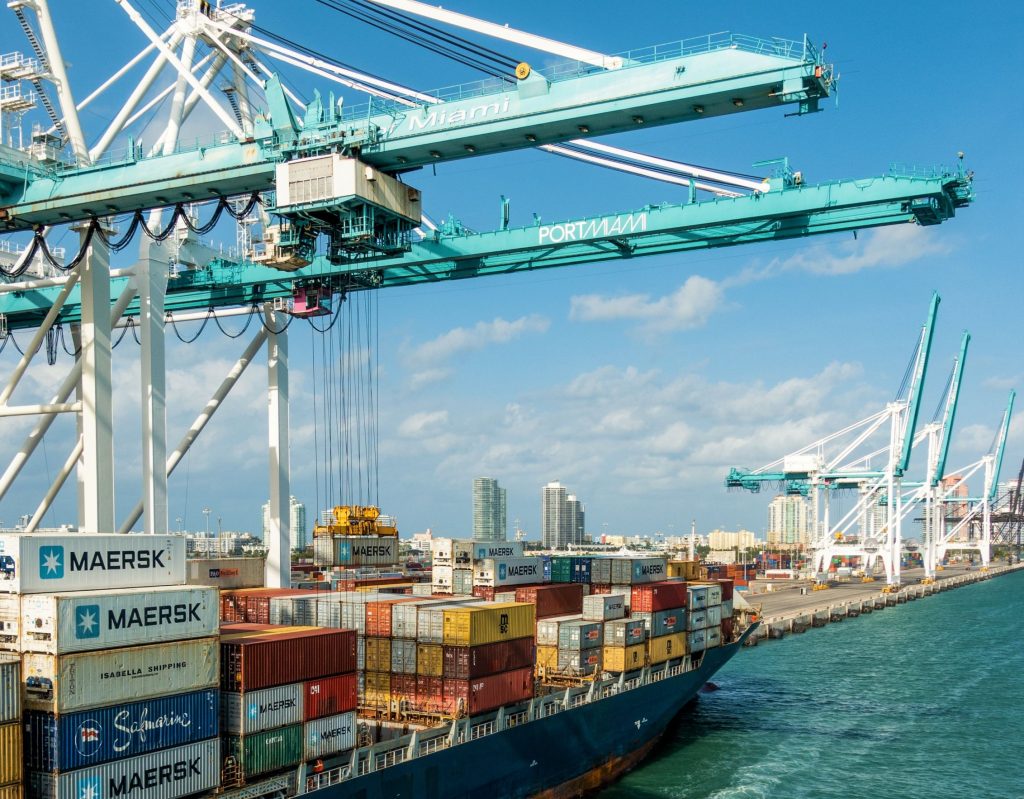


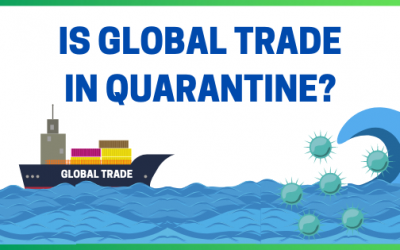


 Photo by Oscar Chan from Pexels