484-595-0100
The Sudden Bankruptcy Filing of Vital Pharmaceuticals Inc / Bang Energy

The Sudden Bankruptcy Filing of Vital Pharmaceuticals Inc / Bang Energy

Could a Large Manufacturer be a Credit Risk?

Vital Pharmaceuticals is the third largest energy drink manufacturer in the U.S. and owns the Bang Energy brand. Now it is filing bankruptcy in the wake of multiple lost lawsuits, the latest of which awarded $293 million to Monster Energy for its false advertisement of its “Super Creatine” ingredient’s health benefits.  This is one of the largest awards under the Lanham Act. Vital Pharma’s sudden fall into bankruptcy highlights the need for suppliers to consider credit insurance to protect against buyer non-payment and ultimately their balance sheet.  Vital Pharma owed more than $500 million to unsecured creditors.

Vital Pharma Fast Facts and Timeline

  • Vital Pharmaceuticals Inc, a private company, located in Pembroke Pines, FL manufactures and distributes sports supplements under the name VPX, Redline Power Rush, an energy supplement, and Bang Energy, an energy drink.
  • Vital Pharmaceuticals introduced the Bang Energy drink product line in 2012.
  • Bang Energy was marketed as a “performance-enhancing and sports nutrition beverage” due to its “super creatine” ingredient.
  • According to Marketwatch the global energy drink market size was valued at $57 billion in 2021 and expected to reach $75 billion by 2027. Vital Pharmaceuticals / Bang Energy is the third largest energy drink manufacturer behind Red Bull Energy (38% of global market share) and Monster Energy (35% of global market share).
  • Vital Pharmaceuticals recently lost two lawsuits and settled a third which forced them to file for bankruptcy protection.

Key Legal Dispute Dates

  • 2018: Monster Energy Co filed a complaint in U.S. District Court for the Central District of California against Vital Pharmaceuticals, alleging false advertising.
  • 2020: PepsiCo and Bang Energy enter into exclusive distribution agreement
  • 2020: Bang Energy terminated the distribution agreement. PepsiCo sued for breach of contract.  An arbitrator ruled in PepsiCo’s favor that they were still the exclusive distributor.
  • June 2022 Bang Energy CEO Jack Owoc announced that all disputes with PepsiCo had been settled.
  • July 2022: In a separate lawsuit Monster Energy and Orange Bang (a separate beverage company) were awarded $175M through arbitration award for trademark infringement
  • Sept 2022: A jury sided with Monster Energy in its lawsuit against Bang Energy and awarded Monster $293M for false advertising regarding its “super creatine” content.
  • Vital Pharmaceuticals filed for Chap 11 on Oct 10, 2022. The three largest unsecured creditors were:
    • Monster Energy Company – $292,939,761
    • Orange Bang, Inc. – $214,757,614
    • PepsiCo – $115,000,000

Low Credit Risk Until Bankruptcy Filing

Vital Pharmaceuticals was a growing company in the expanding energy drink sector.  There wasn’t any indication, even in late September, that they would file for bankruptcy protection in early October.  Suppliers would have needed to be aware of the status of the lawsuits and the size of the potential jury awards while also reducing credit terms to avoid a loss.  The Schedule F includes a number of large, sophisticated companies extending significant credit to Vital Pharmaceuticals.  It remains to be determined how much, if any, they will recover through the re-organization process.  One supplier, using credit insurance as part of a comprehensive credit risk mitigation strategy, was very thankful that they had a policy in place.  The loss would have had a significant impact on the equity in their business.

Trade Credit Insurance

Trade credit insurance protects suppliers against non-payment due to insolvency and slow-pay.  The Vital Pharmaceuticals bankruptcy filing highlights that even when a buyer appears to be a low credit risk, unseen external factors can substantially increase the buyer’s credit risk. This lack of visibility can expose suppliers to significant credit losses. Even beyond legal liability, other external factors can silently increase the risk of a buyer, such as loss of a significant customer/revenue, loss of financing, change of ownership, etc.

About Securitas

Since 2004, Securitas Global Risk Solutions has helped clients develop credit and political risk solutions. As independent trade credit and political risk specialists, we are focused on developing comprehensive solutions that meet the needs of our clients. Please feel free to call us with any questions, or if we can be of any assistance.

Recommended News

Let’s Get in Touch

Office

900 West Valley Road Suite 701, Wayne, PA 19087

Call Us

484-595-0100

Major Country Risk Developments

Major Country Risk Developments

Posted with permission from greatamericaninsurancegroup.com

 Overview

The global economy has suffered four shocks since 2020: the pandemic; a huge fiscal and monetary expansion in response to it; post-pandemic supply side shortages, in which pent-up demand hit supply constraints in industrial inputs and commodities; and finally, Russia’s invasion of Ukraine, which hit energy supplies and prices in a way not experienced before. An economic slowdown appears unavoidable as we approach 2023, with stubbornly high inflation and the response to it [rising interest rates], combined with soaring energy costs – leaving consumers globally with far less discretionary spending.

The IMF is now forecasting global growth of 3.2% in 2022 and 2.7% in 2023. Those estimates have been ratcheted down from earlier estimates. Inflation, meanwhile, is projected to be 8.8 percent in 2022, up from 4.7% in 2021, before declining to 6.5 percent in 2023 and to 4.1 percent by 2024.

The global economy faces a thicket of problems from high inflation, tight monetary policy that seeks to reverse more than two decades of easy money, and geopolitical risks ranging from the rise of far-right autocracies to the ongoing and violent war in Ukraine. Risks to the outlook remain largely on the downside. Monetary policy could miscalculate the right stance to reduce inflation. Policy paths in the largest economies could continue to diverge, leading to further U.S. dollar appreciation and cross-border tensions.

The oil market faces almost unprecedented two-way risks at present. On one hand, the possibility of deep recession-induced, in large part, by soaring energy costs around the world in the wake of the war on Ukraine. Meanwhile Moscow has weaponized gas supplies against Europe. Pending EU sanctions on Russia, Russia may remove some of its oil from the market as soon as winter. In reaction to a price cap plan, Russia may decide unilaterally to withhold supply. Or it may disrupt 1.2 million barrels per day of exports through a pipeline carrying Kazakh oil that passes through Russia. Also, global crude demand will likely surge when China finally eases its Covid-19 restrictions.

By any measure this is a big moment for oil prices, the global economy, and the world’s energy order. Crude prices remain high by historical standards. Yet the Opec+ oil cartel, led by Russia and Saudi Arabia, agreed in early October to cut two million barrels of oil per day from existing production supplies – adding salt to the wound for numerous oil-importing nations. Prices at the pump, which dipped over the summer, will begin climbing again. After months of raising supply, Saudi Arabia decided it was time to change course. The newly announced production cuts are designed to reset the market’s sentiment.

A geopolitical breach is also underway, as the decades-old alliance between the U.S. and Saudi Arabia frays in favor of the Saudis tightening their six-year partnership with Russia. Tensions between Saudi Arabia, the world’s largest crude oil exporter, and the U.S., the world’s largest consumer, come as signs of a deepening energy crisis ensues alongside the Russian war in Ukraine. Both Saudi Arabia and Russia stepped up their pursuit of production cuts to halt a recent slide in oil prices which have fallen from $120 per barrel in June to around $90 last month – a drop that has hit Russian state revenues. Russia needed a substantial production cut to raise prices – since Russian oil has been trading at large discounts after European buyers turned away. The U.S. wants to restrict Russia’s oil revenues to starve its military of funding for the war, which makes Saudi Arabia’s continued cooperation with Moscow a growing source of tension between the Saudis and the U.S. In short, Opec+ oil producers have imposed significant cuts in oil supply amid one of the tightest crude markets in recorded history, and ahead of a potential decline in Russian exports over the coming months. The move is a very big gamble on a fragile global economy’s tolerance for more energy inflation.

Energy prices have shot up far above the cost of extraction, production and generation. The result is a massive redistribution of the economic value of energy from consumers to producers. Consider Saudi Arabia: in the previous five years, its exports typically hovered around $20 billion a month. Since the Russian invasion of Ukraine, the value of its monthly exports shot up to $40 billion. Other petrostates are obviously also beneficiaries. Meanwhile, other big emerging economies in addition to India, such as Brazil, Turkey, and South Africa, are facing import bill increases that far exceed any export growth those economies may have had during this period.

Then there is Russia which has racked up enormous surpluses. This is not just a function of high energy prices but also the collapse in its imports. But still, it has made enormous amounts selling oil and gas this year. Russia’s trade surplus has more than tripled since last year, according to the World Bank.

Meanwhile, the U.S. and other G7 countries have advanced a plan to impose a price cap on Russian oil sales – a move that could lead to lower supplies from Russia alongside a tightening of European sanctions against Moscow which takes effect in December. Opec+ producers worry that a price cap planned only for Russia now could later become a precedent for wider use against other producers. The U.S. Treasury has estimated that the G7 plan to cap the price of Russian oil exports would yield $160 billion in annual savings for the 50 largest emerging markets, as Washington insists that the scheme it has championed would put a lid on rising energy costs around the world. However, there are still doubts and uncertainty in the oil market about the extent to which this novel experiment, never before attempted, will work in practice, what its effects will be on the market and how Russia will react.

According to the U.S. Treasury, Europe and East Asia are the two regions most dependent on net oil and oil product imports, which account for 4.7% of GDP, or $55 billion annually. In 16 emerging markets ranging from Mali to Turkey, El Salvador and Thailand, net oil imports account for more than 5% of GDP.

To date, a decline in Russian oil exports to Europe has been largely offset by shipments rerouted to customers such as China, India, and Turkey. However, the International Energy Agency has forecast that Russian oil production will fall sharply once the EU embargo comes into full force – a risk that would drive up energy prices without a price cap in place, according to U.S. officials. A price cap would stabilize world energy prices. Many emerging markets would benefit (from the needed price break) compared to the hammering their economies are currently experiencing. Opec Gulf producers have grown alarmed at the possibility that such a mechanism could one day be applied to them.

Meanwhile, the divergent outcomes of emerging economies will be determined by how well their economies are managed, whether they export commodities, and their level of indebtedness. Before the pandemic, depressed private investment and demand kept inflation too low for central banks that targeted 2%. In that world, government deficits helped by putting upward pressure on inflation. This also tended to push up interest rates, not a bad thing when central banks worried more about rates being stuck at zero. The upshot was that, as far as markets were concerned, governments’ capacity to borrow was infinite.

That world is now over. Inflation in many countries is too high, and structural forces threaten to keep it there for some time. Having belatedly realized this, central banks are raising rates at the fastest pace in 40 years. While some countries acknowledge inflation is a problem they continue to borrow as though limits do not exist. After the stimulus-inflated levels of 2020 and 2021, budget deficits fell sharply across developed markets this year, to an average 4.3% of GDP, according to independent estimates. However, budget deficits in developed countries are projected to rise to 6.1% in 2023 and 6.9% in 2024.

Several European governments are borrowing to defray higher energy costs over the coming winter. Markets are forgiving of those borrowing/spending plans for several reasons. First, by lowering headline energy prices, subsidies make it less likely that high inflation becomes embedded in the public’s thinking and is thus sustained. Second, these outlays are seen as necessary and temporary.

The most vulnerable economies in the developing world are having to run very tight monetary policy at a time when they are dealing with a slowing global economy and energy security. There are debt defaults already underway from lower-income countries that have borrowed in dollars. Bailouts by the International Monetary Fund (IMF) have hit record highs as rate rises push up lower-income countries’ borrowing costs.

USA

Sharp increases in U.S. interest rates and a soaring dollar are causing global alarm. The strength of the U.S. dollar continues to matter because it tends to impose contractionary pressure on the global economy. The roles of the U.S. capital market and the dollar are far bigger than the relative size of its economy suggests. The U.S. capital markets are mostly those of the world, while its currency is the world’s safe haven. Thus, whenever financial flows change direction from or to the U.S., markets around the world are affected. One reason is that most countries care about their currency exchange rates, particularly when inflation is a worry. The danger is greater for countries with heavy liabilities to foreigners, and worse if the debt is denominated in dollars. Many countries will now need help.

The recessionary forces emanating from the U.S. and the rising dollar come on top of those created by the big real shocks. In Europe, above all, its higher energy prices are simultaneously raising inflation which in turn is weakening real demand. Meanwhile, the determination by China to eliminate the coronavirus at all costs, is hitting its economy, as well as its ability to fill overseas orders in a timely fashion.

While the reserve status of the dollar and Treasury debt insulates the U.S. from some of the pressures buffeting the UK, U.S. fiscal policy is just as mis-calibrated. While the sitting U.S. Administration touts the Inflation Reduction Act, which lowers U.S. deficits by $240 billion over a decade, the Administration also passed a law which increased spending on veterans’ affairs, infrastructure, and semiconductors, while taking executive actions that vastly expands various food and health benefits for the needy, as well as cancelling student debt worth between $400 billion to $1 trillion.

Adding that to the 2021 stimulus and the associated interest expense, the Committee for a Responsible Federal Budget, estimates that the Administration will increase deficits by $4.8 trillion, or 1.6% of GDP over a decade. The relaxed attitude toward all this additional debt is shaped by the Administration economists’ assumption that real interest rates – the nominal rate minus inflation- will remain around zero for the coming decade. Federal debt is much more manageable when real rates are lower than the economic growth rate. They have some justification: real rates were well below the economy’s growth rate for a decade before the pandemic.

On the other hand, massive deficits, the Federal Reserve tightening in response to flare-ups of inflation and diminished private savings could all elevate real rates in coming years- as occurred after then- Federal Reserve Chairman Paul Volker crushed inflation in the early 1980’s.

There is some talk of globally coordinated currency intervention, as happened in the 1980’s – which first, weakened the dollar and then, stabilized it. Until the Federal Reserve is content with where inflation is going, that cannot be the case this time. Currency intervention aimed at weakening the dollar by just one or even several countries is unlikely to achieve sufficient stability.

A more important question is whether monetary tightening is going too far and in particular, whether the principal central banks are ignoring the cumulative impact of their simultaneous shift towards tightening. An obvious vulnerability is in the eurozone, where domestic inflationary pressure is high, and a significant recession is probable in 2023. However, the president of the European Central Bank has stated clearly: “We will not let this phase of high inflation feed into economic behavior and create a lasting inflation problem. Monetary policy will be set with one goal in mind: to deliver on our price stability mandate”. Even if this should turn out to be overkill, central banks have little option. They must do what it takes to curb inflation expectations.

We are unsure how much tightening might be needed. In such times the perceived sobriety of borrowers matters a lot. This is true of households, businesses, and not least, governments. The financial tide is going out: only now will we notice who has been swimming naked.

Germany

The government unveiled a 200 billion euros “protective shield” for businesses and consumers struggling with soaring energy costs, the largest aid package adopted by a European country since the start of the energy crisis.

The centerpiece of the plan, financed by new borrowing, is an emergency cap on gas and electricity prices that have soared since Russia first slashed its gas exports to Europe over the summer. Disruptions in the flow of gas from Russia have pushed up prices for the fuel to record levels and raised fears of a winter gas shortage in the eurozone’s largest economy. Companies have cut production and consumers faced with rising inflation have reined in spending. A flash estimate published by Germany’s statistical agency showed that inflation hit a 70-year high of 10.9% in September.

A joint forecast by Germany’s leading economic institutes predicts the country will slip into recession next year, with GDP contracting by 0.4%-0.6%. Leading German policymakers assert that the country is in an energy war for its prosperity and freedom. The recently announced 200 billion euros aid for consumers and businesses, will be financed through new government borrowing and channeled through the reactivated Economic Stabilization Fund (WSF), an off-budget facility that was set up in 2020 to help companies survive the lockdowns and other public health measures imposed during the pandemic.

Despite the setting up of this “protective shield” around the economy, Germany is sticking to a fiscal policy based on stability and sustainability. A group of experts are working on details of a gas price cap and will present recommendations in mid-October. It is expected that prices for a set, basic volume of gas and electricity will be capped, with usage higher than that priced at market rates. Energy suppliers would be compensated by the state for having to sell their gas and electricity to consumers for a lower price. The German economy minister scrapped a previous gas levy on all consumers. The levy had been designed to help energy companies (such as Uniper, which had been plunged into crisis after being forced to buy expensive alternatives to Russian gas on the spot market) but was rendered moot by the government’s decision to nationalize Uniper in September.

The German government has warned of the risk of electricity shortages this winter. The government insists that despite new aid measures, German energy use must be reduced. Consumption, particularly in the private sector, is not falling as much as the government wants. The idea of a gas price brake has long been discussed in the German government, but it is contentious. The fact that so much of German gas is imported means any reduction in its price would require massive subsidies which would then pump new purchasing power into the private sector. This would stoke inflation and would be destabilizing and problematic for lower income households.

Germany is relying on highly polluting coal for almost a third of its electricity, as the impact of government policies and the war in Ukraine leads producers to use less gas and nuclear energy. In the first six months of 2022 Germany generated 17% more electricity from coal (over the same period last year). The leap means almost one-third of German electricity generation now comes from coal-fired plants, up from 27% last year. Production from natural gas, which has tripled in price since the beginning of the Russian war on Ukraine, fell 18% to only 11.7% of total generation.

The shift from gas to coal was sharper in the second quarter. Coal-fired electricity increased by an annual rate of 23% in the three months to June, while electricity generation from natural gas fell 19%. At the beginning of 2022 more than 50% of German gas imports came from Russia, a figure that fell slightly over the opening half of the year. Opposition groups accused the government of “madness” over its decision to idle the country’s three remaining nuclear power stations from the end of this year. Electricity generation from nuclear energy has already halved after three of the six nuclear power plants that were still in operation at the end of 2021 were closed during the first half of this year. The government now says it will keep on standby two of the remaining three nuclear power stations, which were all due to close at the end of this year.

The figures highlight the challenge facing European governments in meeting clean energy goals going forward. Germany has been trying to reduce its reliance on coal, which releases almost twice as many emissions as gas and more than 60 times those of nuclear energy, according to estimates from the Intergovernmental Panel on Climate Change.

One bright spot from the data was an increase in use of renewable energy. The proportion of electricity generated from wind power rose by 18% to 26% of all electricity generation, while solar energy production increased 20%.

The success in moving away from gas towards other energy sources could mean that the risk of hard energy rationing over the winter are less severe now, even with little or no Russian gas flows. However, a recession in the eurozone’s largest economy is still expected – as a large part of the impact comes via higher prices and because industries and households still rely on gas for heating. German industrial production slid 0.4% between July and September. Production at Germany’s most energy intensive industries fell almost 7% in the five months after Russia’s invasion of Ukraine. The consensus is that the demand destruction caused by the surge in prices will send the German economy into recession over the winter.


Meanwhile, Germany’s manufacturing export model appears under threat. Voices in government are arguing that having already suffered from reckless reliance on Russian gas, Germany’s economic dependence on another belligerent autocracy in the form of China has left it dangerously exposed.

Media reports suggest that Germany’s economy ministry run by the Greens, is looking to reducing support such as state investment and export guarantees for German companies operating in China. The stated intention is to achieve diversification rather than reducing exports from or investment in China overall. However, reduction in operations in an economy the size of China’s is unlikely to be made up by foreign markets elsewhere, it may well form part of a long-term reorientation away from manufacturing mercantilism.

The dangers to the German and wider EU economies from Berlin’s export-orientated model have long been clear. Since the early 2000’s, by suppressing domestic wages and demand, and prioritizing current account surpluses, Germany ultimately shifted production home and unemployment to the rest of the eurozone.

This model is also more at odds with the EU’s stated approach to trade policy. Traditionally, the German export lobby (and its supply chain satellites in central and eastern Europe) has been important in pushing for free trade agreements – even in these days it is often more interested in investing in consumer markets like China than exporting there.

The Greens have emerged as Germany’s chief Russia and China foreign policy hawks – and have pointed out the difficulties and contradictions of this position. A draft EU deal with the South American Mercosur trading block signed in 2019, is widely known as “cars for beef”. It gives European automakers access to Brazil’s vast consumer market, overriding the protests of French and Irish cattle farmers against Brazilian imports. In the final days of its six-month EU presidency in 2020, Germany also drove through the bilateral Comprehensive Agreement on Investment (CAI) with China, largely designed to protect German operations in China.

Germany has passed a law, making companies responsible for human rights abuses in their supply chains, ahead of similar initiative by the EU. Brussels has also enacted a ban on products made with forced labor. But German industry leaned against such moves. Germany’s domestic legislation does not create a new civil liability for companies, and their obligations to find and eliminate abuses are considerably weaker in lower tiers of their supply chains.

For now, Germany is having enough trouble with its rushed attempt to do without Russian gas. Fundamental structural change in business and the country’s political economy will take a lot longer. Still, if the EU is serious about reorienting its trade policy and Germany about rebalancing its economy towards domestic demand, ending the export bias is an important step. In the meantime, reducing artificial incentives for companies to become dependent on China is a good development in itself.

Eurozone

Europe needs to replace Russian gas. That makes liquified natural gas (LNG) imports to Europe more important. Not every country on the continent has sufficient infrastructure to import the LNG sent from the U.S., Qatar and elsewhere. Floating storage and regasification units [FSRU’s] offer countries a cheaper, flexible solution to importing liquified gas.

Relatively quickly, these vessels-refitted from LNG tankers- can anchor up, connect to the local gas networks and turn imported super-cooled gas into piped methane. Moreover, building an offshore regasification plant can cost $10 billion compared with the roughly $500 million new-build cost for an FSRU.

Since the Ukraine war countries such as Germany, which has no onshore LNG terminals, have scrambled to lease available vessels. Germany plans to charter three for this winter. The Netherlands expects gas to flow soon through two FSRU’s recently arrived at the port of Eemshaven, where a new floating terminal sits close to the north-western border with Germany. Germany’s gas storage has filled up faster than planned. France announced that its reservoirs were 90% full.

These relatively small vessels have two redeeming features. They are quick to set up and can later be repurposed back into LNG tankers or for other types of commodities.

Meanwhile, pressure is building on the EU to launch emergency action to support the strategically important European smelting industry as another plant announced savage production cuts. Germany’s Speira is the latest aluminum producer to slash production because of soaring energy costs as the crisis deepens for one of the continents key industrial sectors. The  recent cuts add to calls for help to save a sector that is facing an existential threat from skyrocketing power prices and comes ahead of a meeting of EU energy ministers that aim to soften the pain for households and business through emergency interventions.

The nonferrous metals trade body said industry problems, which have led to unprecedented cuts to smelter production over the past year, will deepen unless the EU intervenes. The industry is concerned that the winter ahead could deliver a decisive blow to the operations of many companies. The cost of energy has become far higher in Europe than in Asia and the U.S. following Russia’s cutting gas supplies to the continent. This is threatening to wipe out corners of the regions industry. Speira explained that energy prices have become too high to maintain production in Germany and the company expects little price relief in the near-term. Europe is facing similar challenges at many other aluminum smelters. Companies are preparing to curtail 50% of all smelter production until it becomes possible to sustain value.

The move to reduce smelter production at the Rheinwerk plant near Dusseldorf to 70,000 tons a year beginning in October, follows Aluminum Dunkerque, Europe’s largest primary smelter for metal, announcement that it would reduce output by more than 20%. The latest wave of cutbacks follows indefinite shutdowns of Norsk Hydro aluminum smelter in Slovakia and a zinc smelter in the Netherlands run by Nyrstar, which is controlled by commodities trading giant Trafigura.

While Europe only accounts for 6% of global aluminum production, the metal is of strategic importance because of its use in aerospace, defense, and the auto sector, as well as in buildings and to produce drink cans. Known as “solid electricity,” aluminum is one of the most vulnerable sectors to the surge in energy prices that shot up after Russia cut gas supplies to Europe.

Before the crisis, electricity was about 40% of an aluminum smelter’s costs with one ton taking five megawatt hours of electricity to produce, enough to power the average home for about five years. Producers now say it is nearly impossible to sign long-term power supply deals when their current contracts expire with electricity prices up over 10-fold of their average over the previous decade. Gas, which is used to generate power, heavily influences electricity prices.

Italy, one of the world’s most heavily indebted governments, has seen its bond yields shoot higher this year, even though incoming right-wing Prime Minister Giorgia Meloni has promised fiscal rectitude. In part, that’s because the European Central Bank is no longer backstopping member governments by purchasing additional debt.

UK

Recently proposed tax cuts outlined by the new UK government [now partially withdrawn] caused great alarm. They were intended to be permanent and to reduce deficits by boosting growth – without details on exactly how that would be accomplished. It was not so much that the package was large, but that the government did not seem to consider its ramifications before announcing it.

The 6% fall in the value of the British pound and a half-percentage point rise in government bond yields following the unveiling of the government’s plan, reflect the markets belief that the Bank of England would need to raise interest rates more in response to the package, while investors (including foreigners) would be buying a lot more British debt. Some estimates put the sum at $240 billion of new debt needed to finance the budget deficit in 2023 and $90 billion being sold by the Bank of England as it unwinds the bond buying of previous years. In total, that’s equivalent to a staggering 12.2% of British GDP. The Bank of England said it would buy  bonds to stabilize markets. As markets demand higher bond yields as compensation for greater supply and greater risk, so too UK deficits will widen as net financing needs rise further.

Surging wholesale gas prices are putting the UK on a path to exceed 18% inflation, the highest rate among larger western economies. This projection heaps more pressure on UK’s Conservative government to address a worsening cost of living crisis; and comes as gas prices for next-day delivery surged by 33%. Rapidly increasing prices for natural gas have left recent economic projections out of date. UK rate of inflation has exceeded expectations in most months of this year as price rises have spread through the economy. The energy regulator Ofgem indicated that the projected price increases to households of average usage of energy from October -January will be up 75%. Meanwhile, the strength of the pound [versus the euro and dollar] remains close to its lowest levels since 1985. Sterling is down 20% against the dollar in 2022, putting it in contention for the worst performer among G10 currencies this year, running neck and neck with the Japanese yen.

Markets are pricing in a 1.5 percentage point interest rate increase by the Bank of England- to 3.75% in November. British banks have also begun pulling mortgage loans in response to rising yields on government bonds (gilts), with mortgage rates expected to rise substantially.

The turmoil in the UK underlines the importance of fiscal restraint, especially with inflation at 40-year highs and central banks raising interest rates aggressively. In the UK it seems a major experiment is underway as the state simultaneously accelerated spending/borrowing while the central bank steps on the brakes by hiking interest rates.

The IMF has been closely monitoring developments in the UK and has stressed that given elevated inflation pressures, it does not recommend large and untargeted fiscal packages. The Fund said it understood the UK government’s desire to help families and businesses deal with the energy price shock while boosting growth with supply-side reforms. But it raised the concerns that tax cuts, which will disproportionately benefit high earners, will likely increase inequality in the economy.

Brazil

The last time the left was in power in Brazil, the country’s most important company was caught up in a multibillion-dollar corruption scandal and was almost buried under a mountain of debt. After emerging from the scandal and financial turmoil of the previous decade, $76 billion oil and gas giant Petroleo Brasileiro [Petrobras] is now  leaner, more profitable and a cash machine for its owners.

As Latin America’s largest economy prepares to choose a new president, very different visions are on offer for the state-controlled group.

Incumbent rightwing leader, Jair Bolsonaro, has spoken of privatizing Petrobras [the region’s largest oil and gas producer and the most valuable listed business]. His main challenger and the frontrunner, leftist ex-president Luiz Inacio Lula da Silva, intends to reassert greater government influence over Petrobras – once considered the crown jewel of the Brazilian economy.

Lula’s manifesto calls for the oil giant to once again be an integrated energy company, present in fertilizers, renewables and biofuels- areas at one point it largely decided to exit in order to focus on its core activity of pumping deep-water crude. There would also be a bigger role for the company in Brazil’s eventual clean energy transition. Lula wants the company to work towards having national self-sufficiency in refined derivatives, such as petrol and diesel, and stop charging international prices for fuel sold domestically. Lula’s ambition is for Brazil to be an exporter of petroleum products and an exporter of crude oil.

Lula’s resource populism taps into public discontent in Brazil over high living costs, a sentiment inflamed by bumper profits at Petrobras. Like other oil majors, the company benefited from a rise in crude benchmarks triggered by Russia’s invasion of Ukraine. Brazilian consumers didn’t. In addition to beating predictions of 27% increase in net income to $10.1 billion during the second quarter of 2022, Petrobras was the world’s biggest corporate dividend payer in the period, according to research by a leading Wall Street investment firm.

Private shareholders, including western financial institutions, together hold almost two-thirds of Petrobras’ equity, but with more than half of the voting rights the Brazilian state wields control. Despite a recent tumble, the Sao-Paulo-listed preference shares are up 50% so far in 2022, outperforming the local stock index.

Mr. Lula’s campaign proposals have unnerved some investors. The fear is a return to the days of political interference in the running of Petrobras under Lula’s Workers Party, which ruled Brazil for 13 years until 2016. Shareholders accused the then PT government of using Petrobras as an arm of the government. Some shareholders fear a return to old habits should Lula be reelected. One worry is that renewed diversification plans requiring extra investments could hit the company’s profit margins and cash generation.

Still, others hope that Lula, who governed Brazil for two terms between 2003-2010, will prove pragmatic on economic matters and avoid radical interventions in the economy, the private sector, and Petrobras in particular. It’s recalled that during Lula’s time in office, Petrobras found vast offshore oil and gas deposits known as deep-salt reserves that ranked among the world’s largest discoveries in decades. Mismanagement and meddling in the company took a heavy toll. Under Lula’s chosen successor Dilma Rousseff, Petrobras was forced to keep prices artificially low in a bid to tame inflation. A former chief executive estimated this cost the group some $40 billion. Elsewhere, refinery projects went over budget and unfinished. Borrowing exceeded $130 billion by 2015, making Petrobras the most indebted company in the sector.

Since those crises, the group has tightened compliance and reduced its gross debt below $54 billion. It has looked to offload assets such as mature fields, petrol stations, and refineries, concentrating instead on exploration and production in the Atlantic Ocean. The company has embraced recovery, not only financially, but also in its governance and credibility.

Still, the Bolsonaro era has not been without tumult. The rightwing populist has regularly attacked Petrobras over petrol costs and fired three chief executives in little over a year. But as a measure of the robustness of its overhauled internal procedures, the company has maintained a policy of moving refinery gate prices in line with dollar-based rates on external markets. Brazil produces enough crude for its own needs but lacks adequate refining capacity to meet domestic demand – and must rely on shipments of derivative products from abroad.

Local businesses point out that oil is a global market – and that there is no room for artificial prices or price controls. With at least one-fifth of diesel consumed in Brazil coming from overseas, importers need to be able to buy at the international price and sell in Brazil. Lula’s advisers have sought to soothe concerns. They have advanced a theory of one way to implement his pledge to “Brazilianize fuel prices” via reference values formulated by a government agency, with vendors free to follow or ignore them. This theory is, so far, not taking hold.

Privatization of Petrobras is viewed as the best possible outcome by some. This would remove the threat of government intrusion, and hence would free the company’s share price, which is considered undervalued compared to many of its peers.

If the polls are correct and Lula triumphs, investors can find some comfort in current legal reforms and new corporate governance norms at Petrobras approved in the wake of the ‘car wash’ scandal. These are designed to prevent government’s using state-controlled enterprises for political gain and oblige ministers to reimburse any costs incurred as a result of enforced subsidies. But as the controlling shareholder, the state can still effectively shape company strategy by replacing the board and the top job.

South Korea


The Bank of Korea will not confirm that a currency swap arrangement with the U.S. Federal Reserve will go into effect soon – as the Korean won continues to slide against the dollar to the lowest levels since March 2009. The won has fallen 155 against the dollar since the beginning of 2022, more than any other major currency in Asia apart from the Japanese
yen.
Korea is struggling to defend its currency as the Federal Reserve sharply raises interest rates to curb inflation. Expectations of a currency swap deal have grown after it was revealed that both countries had expressed interest in reopening a currency swap line. The Bank of Korea and the U.S. Federal Reserve signed a $60 billion currency swap agreement in March 2020 as an emergency measure to stabilize foreign exchange markets, but the deal expired at the end of 2021.

Calls for an emergency swap deal have intensified amidst expectation that the dollar’s rally -near its highest level in more than two decades against major currencies- to continue at least until the end of the year. The consensus is that such a deal, which will allow South Korea to borrow U.S. dollars at a present rate of exchange for won, as a last resort to stabilize the volatile market.

Authorities in South Korea and other Asian markets are preparing for worst-case scenarios as the dollar is likely to continue to rise with the Federal Reserve’s rate hikes, but there is not much they can say to reverse the trend other than gradually raising their own interest rates to slow the pace.

Export-dependent countries such as South Korea are under increasing pressure, with the country’s growing trade deficit and higher oil prices dimming the won’s outlook. South Korea reported a record trade deficit of $9.5 billion in August.

The authorities have stepped up oversight of currency markets, with the Bank of Korea asking currency dealers to provide hourly reports on dollar demand after a series of verbal warnings failed to halt the won’s descent.

A South Korean panel that overseas the country’s massive National Pension Service, the world’s third-largest pension fund, is drawing up new rules to improve its foreign exchange management policy – as a top priority.
Meanwhile, the government is trying hard to defend the psychologically important Won 1,400:US$1 threshold. It has intervened in the market to slow the pace of the won’s decline.

The won is not the only victim of a surging dollar in Asia. The renminbi has breached the psychological level of Rm7 : US$1 despite Beijing’s verbal warnings and other attempts to shore up the currency.
Separately, South Korea’s science ministry has indicated that “sense of crisis” is gripping the country’s semiconductor industry, as Korea braces for greater challenges from U.S. and China in an intensifying global chip war.

There is growing fear among Korean officials and industry executives that the country will shed production facilities as domestic chipmakers, lured by subsidies and tax incentives, rush to build semiconductor plants in the U.S. China is catching up fast in the memory chip sector on the back of generous state funding.
New Korean legislation passed in August have laid the legal groundwork to support the semiconductor industry against severe competition from the U.S., China, Japan, Europe, and Taiwan. It reflects a sense of crisis about South Korea’s competitiveness on the global stage and the new legislation is designed to strengthen Korea’s competitiveness in supply chain and security.
The complaint is that Korean companies have received relatively smaller tax benefits from the government and suffered from a lack of talent compared to China, the U.S. and Taiwan. Industry officials want the South Korean government to provide more support for domestic chipmakers as the U.S., China, and Europe boost investment in the sector.
South Korea remains the world’s biggest memory chip producer, with Samsung and SK Hynix together controlling about 70% of the global Dram market and more than half of the Nand flash market. Dram chips enable short-term storage for graphic, mobile and server chips, while Nand chips allow for files and data to be stored without power.

But the Korean chipmakers technological edge over U.S. rivals in the Dram business appears to be narrowing, while Chinese chipmakers are expanding their market share in the Nand flash market. Apple indicated that it is evaluating sourcing Nand chips used in some iPhones used in China from a Chinese chipmaker. Analyst have also noted that much of the R&D being conducted by Korean companies on next generation semiconductor technologies are taking place in the U.S.
The Korean government has taken the lead in mounting a turnaround to this challenge, emphasizing that semiconductors will determine the fate of the economy, while promising greater backing for the industry. It has expanded tax breaks, reduced red tape and introduced two pending bills known as the K-Chips Acts that are aimed at bolstering new activity. The government also intends to provide funding for essential infrastructure for chip production facilities such as electricity and water supply. The aim is to develop large ‘chip clusters” that will gather production and research and development to attract foreign chipmakers to Korea. The government also intends to train 150,00 people over 10 years to boost the semiconductor workforce, thereby addressing concerns over a lack of adequate local talent in the sector.

By Byron Shoulton, FCIA’s International Economist
For questions / comments please contact Byron at
bshoulton@fcia.com

What is Trade Credit Insurance?

If you are a company selling products or services on credit terms, or a financial institution financing those sales, you are providing trade credit. When you provide trade credit, non-payment by your buyer or borrower is always a possibility. FCIA’s Trade Credit Insurance products protect you against loss resulting from that non-payment.

Since 2004, Securitas Global Risk Solutions (“Securitas”) has worked with insurers to help clients worldwide develop credit and political risk transfer solutions that provides value on numerous levels.  As an independent trade credit and political risk insurance brokerage, Securitas is focused on developing comprehensive solutions that meet the needs of clients, ensuring complete understanding of policy wording and delivering excellent responsive service.


Recommended News

Let’s Get in Touch

Office

900 West Valley Road Suite 701, Wayne, PA 19087

Call Us

484-595-0100

Inflation expectations yet to decouple from ECB target

Inflation expectations yet to decouple from ECB target

Used with Permission from atradiuscollections.com

Despite rising inflation in the eurozone, we argue it has not yet sprung loose from the ECB target in the medium term

  • Inflation in the eurozone is high and well above the 2% target set by the European Central Bank.
  • The current high inflation rate is to a large extent driven by pandemic-related factors and energy price increases related to the Russia-Ukraine war. We also observe that inflation expectations have not yet decoupled from the ECB’s official target rate. This makes us to believe that inflation will come down in the short term. A simple calculation exercise confirms this picture.
  • We conclude that inflation projections in the medium term have not yet sprung loose from the official ECB target and the current moderate intervention policy appears justified.

ECB ends wait-and-see


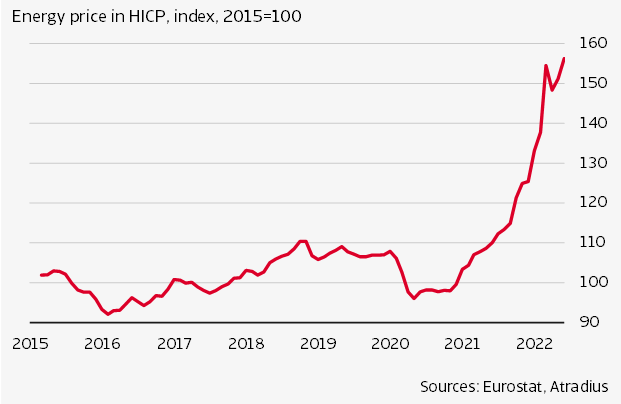
High inflation is the current hot economic topic. In June, inflation was running at over 11% in the Netherlands; for the eurozone it was nearly 9%, which is surely a record. It is also sure that the inflationary bite is being felt, particularly in the purchasing power of lower income groups. The question is, how long will this high inflation last? In recent months, energy prices have gone through the roof (see figure 1), with geopolitical developments playing a major role. If the pressure on these prices abates, inflation will also ease off. In principle, the monetary authorities should then not need to intervene much, if at all

But the ECB has decided not to wait any longer. In its press conference of 9 June, it announced its intention to raise its policy rates by 0.25% in July, and to end its bond purchasing programme. Moreover, it indicated a further interest rate increase in September, this time of 0.5%. But that will depend on how inflation pans out.

In this article we will look at inflation in the eurozone. Using simple calculations, we will explain how, in our view, the current high level of inflation in the eurozone will not be sustained. The main reason for this view is that a recurrence of the energy price explosion is unlikely. In addition, eurozone unemployment, which is far from negligible (over 7%) is weighing on wage rises, thus limiting second round effects of inflation. In this respect, the ECB acts as a lock on the door. Yes, inflation expectations are rising, but have not yet de-anchored from the official target of 2%.


Energy price in HICP index 2015-2022

Major impact of energy price rise


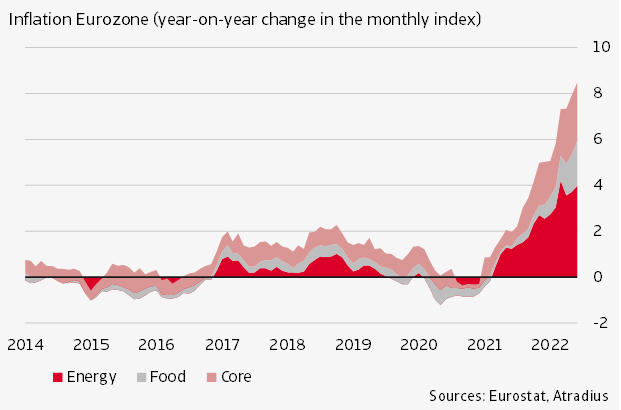
Energy prices have played a major role in the high inflation of recent months (figure 2). Yet this accounts for a relatively limited share (11%) of the total price index. However, on a year-on-year basis, the energy component has shot up by as much as 42% in June, which had a very sizeable effect on the total price index. Thus nearly half of HICP inflation in June this year – 4.0% points – can be attributed to higher energy prices. Food (including alcohol and tobacco) accounted for 1.9% points, and core inflation stood at 2.6% points.

Inflation Eurozone (year-on-year change in the monthly index

Instead of looking at the contributions of the components energy, food and core, if we focus on the rise of these individual categories, the numbers are even more spectacular: besides the 42% for energy (year-on-year), we see 8.9% for food and 3.7% for core inflation. Clearly, inflation is not only happening in energy prices, food prices have also risen and even core inflation is currently running well above 2%.

Rising energy and food prices may be regarded as temporary. However, when core inflation goes up, this is a sign that inflation is filtering through to the rest of the economy. Moreover, core inflation has already been above the target rate of 2% since October 2021. This will also have played a part in the ECB’s decision to adjust its inflation expectations upwards for 2022 and 2023. That said, there is still an expectation that inflation will subside, a consideration that is reflected in the moderate extent of ECB’s intervention.

Reasoning for declining inflation


Although the ECB has factored in a decline in inflation, it did not give specific reasons for this in its press release. But of course, it has its reasons. We will first look at the arguments in favour of this view. We then present our calculations, based our core argument: a recurrence of the energy price rise is unlikely.

First, underlying factors which have kept inflation moderate in recent decades have not disappeared. At most, they have been somewhat weakened by the pandemic. These factors include (i) globalisation, which weighs on prices thanks to competition from more suppliers; (ii) digitalisation, which makes pricing more transparent; (iii) weak wage growth: from low labour participation, a decline in trade union membership and competition from foreign workers, partly through migration; and (iv) population ageing, which leads to lower aggregate demand as consumer spending declines with age. While globalisation (and migration) may have cooled a little from the pressure of the pandemic and geopolitical tensions, a reversal of globalisation would appear to be out of the question.

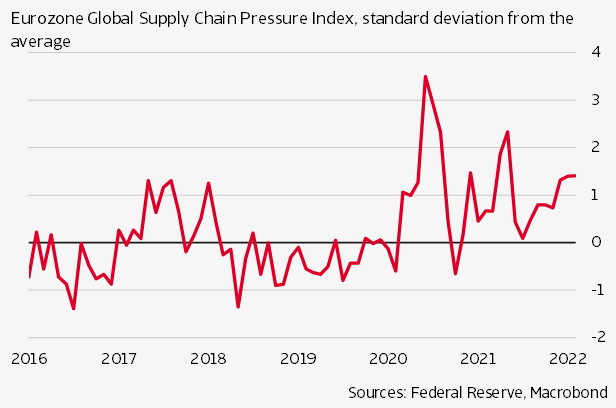
Second, the rise in inflation from the second half of 2021 was initially triggered mainly by the recovery of economic activity after the pandemic. During the pandemic, aggregate demand was propped up mainly by support from governments. But because services such as hospitality, events and travel were mostly closed, demand shifted to goods such as electronics, household appliances and (outdoor) sports goods. This increased the pressure on the international supply chain, which was reflected in long delivery delays and price increases. There were logjams in transport, particularly in container transport, which also pushed up prices. Now that the pandemic has become more endemic in nature, and most sectors have re-opened, the demand for services will increase. Relative demand for goods will lessen, as will the pressure on international supply and transport chains. Thus one source of inflation will lose its strength. This process will be further reinforced by a decline in demand on the back of reduced purchasing power – itself a direct result of inflation. Early signs of this process are already visible in the easing of supply chain pressure (figure 3).

Eurozone global supply chain pressure index, standard deviation from the average

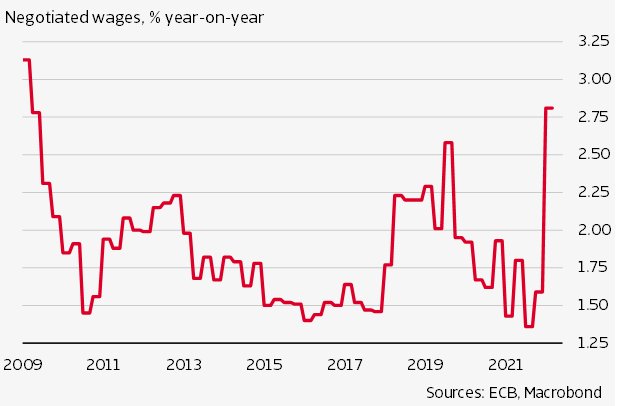
Third, for future inflation development, it is important that current inflation is sufficiently absorbed by the economic agents to prevent new imbalances in the economy. In this respect, wage development is crucial. It is important that companies are not saddled entirely or largely with the burden of inflation, because they would then set in motion a spiral of price and wage rises. So far, this is not the case in the eurozone. Wage rises remain limited at around 3% (figure 4).

negotiated wages, % year-on-year
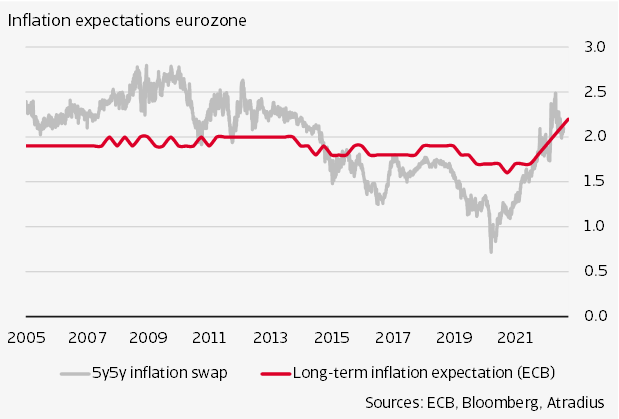
This falls well short of the 8% inflation rate and will act as a brake on any tendency of European companies to shore up prices.  In the wage bargaining process, important considerations are the above issues such as unchanged inflationary pressure from underlying factors and easing pressure in the supply chains. The role of the ECB as guardian of the euro also plays a part: do the economic players expect that the ECB will ultimately be able to guarantee price stability through adequate policy response? These elements coalesce in the inflation expectations. Although these have gone up, they do not currently give reason for undue concern (figure 5).
Inflation expectations eurozone
The picture generated by this reasoning is one of inflation that is not sustainable at the current high level. We now substantiate this further with our calculations which are based on a temporary rise in the energy and food indices.

Calculations confirm the picture


We calculate the expected inflation from June 2022 to end 2023 in a simple manner. This involves looking at the year-on-year percentage changes in the monthly index – for example the difference between June 2022 and June 2021. We took the following approach.

For the period concerned, we calculated the price index of the components energy, food (including alcohol and tobacco) and core. The basic premise for the development of the indices of energy and food from June 2022, is the average of the rise in the sub-index for the period 2015-2019. Thus our conclusion is that the current state of energy and food price development cannot last. We will explain why.

With regard to the energy prices, we base our view on the underlying reason for the recent price rise: the war in Ukraine, and in particular the ensuing sanctions. These have pushed oil and gas prices to unprecedented heights. However, any further rise would require a second shock, such as major disruption to the Russian oil and gas supply. This could conceivably be an effective boycott of Russian oil or Russia turning off the gas supply to Europe. However, we don’t see this happening yet. True, with its sixth package of sanctions, the EU has aligned with the G7’s oil boycott, but the EU boycott will not take effect for another six months. Moreover, the G7 is working towards limiting the effect of the sanctions on oil prices. Yes, it appears Russia is reducing gas deliveries. But it is highly questionable whether gas deliveries will be fully stopped; it is certainly not in Russia’s interest to lose this easy source of money – especially at current high prices – to fund its war. Russia’s actions in this regard may prolong turbulence on the energy markets. However, we concur with the expectations of the World Bank and the OECD that energy prices will gradually stabilise. The same is true for food prices, with the pressure on supply from the production and delivery problems in Ukraine being absorbed by ramped-up production in other countries, such as the US, Argentina and Brazil.

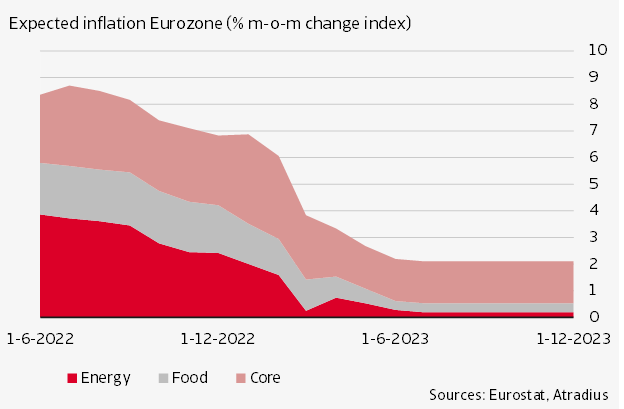
Expected inflation Eurozone (% m-o-m change index)
Figure 6 shows the result of the calculations: eurozone inflation will have peaked in July this year and the rate will slide gradually until the end of the year, followed by an acceleration of the downward trend from early 2023. This will culminate in inflation of just over 2% by the end of 2023.

Just to give an idea of the effect of the calculation: In June, the energy index stood at 156 and we estimate it to reach 160 by the end of 2023. Food inflation will go from 121 to 124. These numbers represent increases of 2.5% and 2.4% respectively. Our estimates for core inflation are based on a shorter and more recent period, i.e. the average rise of the sub-index from July 2020 to June 2022. We factor in a second round effect of current inflation as well as the underlying (downward) pressure on inflation that we have explained above. For the forecast period until end 2023, the core inflation index will rise from 111 to 114, which represents an increase of 3.3%. To calculate the HICP, we used the weights of the sub-indices from June 2022.

The figure clearly shows that the energy component has an over-sized role in current inflation. This effect is evident from the (expected) energy sub-index, which, according to our calculations will reach 157 in December 2022 – a rise of 26% on the December 2021 index. However, if we look at the index for March 2023 and compare it with March 2022 when it stood at 154, we see a rise, i.e. inflation, of just over 2%. In other words, the inflationary spike of 2022 is matched by its mirror image in a drop in 2023. This is a simple, but powerful mathematical conclusion which does not require any further assumptions. The current high inflation is not here to stay.

Our calculations result in an average HICP of 7.9% in 2022 and 3.5% in 2023, with core inflation running at 3.6% and 2.9% respectively. This compares with the ECB’s reckoning for HICP of 6.8% and 3.5% respectively for 2022 and 2023 and average core inflation of 3.3% and 2.8%. Thus inflation expectations have not yet sprung loose from the official target rate, and the ECB’s current moderate policy appears justified.

John Lorie, Chief Economist
john.lorie@atradius.com
+31 20 553 3079

Theo Smid, Senior Economist
theo.smid@atradius.com
+31 20 553 2169

Dana Bodnar, Economist
dana.bodnar@atradius.com
+31 20 553 3165

You can read the original article on Atradius’ website at https://atradiuscollections.com/global/reports/economic-research-inflation-expectations-yet-to-decouple-from-ecb-target.html

About Securitas

Since 2004, Securitas Global Risk Solutions (“Securitas”) has helped clients worldwide develop credit and political risk transfer solutions that provides value on numerous levels.  As an independent trade credit and political risk insurance brokerage, Securitas is focused on developing comprehensive solutions that meet the needs of clients, ensuring complete understanding of policy wording and delivering excellent responsive service.

Recommended News

Let’s Get in Touch

Office

900 West Valley Road Suite 701, Wayne, PA 19087

Call Us

484-595-0100

Liquidity matters: Corporates may need half a trillion of additional working capital requirement financing in 2021

Liquidity matters: Corporates may need half a trillion of additional working capital requirement financing in 2021

Used with Permission from eulerhermes.com

Summary

      • In 2020, Working Capital Requirements in the West increased (+5 days in North America and +1 day across Western Europe) while it dropped in regions such as Latin America (-3 days), Eastern Europe (-2 days) and APAC (-1 day). Inventory management and government support explain most of this divide. In the US and EU, severe lockdowns pushed companies into a “forced” stockpiling mode, which was fortunately tempered by the “invisible bank”, i.e. the very accommodating management of payment terms between customers and suppliers, , partly financed by liquidity support measures. 2020 saw a surge in WCR across industrial sectors: +13 days for metals to 95 days, +9 days to 117 days for machinery, +4 days to 84 days for paper and +3 days to 87 days for automotive.
      • Looking ahead, we estimate that large companies will face a record increase of EUR453bn in WCR  in 2021, equivalent to +4 days of turnover, up to EUR8.4trn. This comes in a context of the strong demand rebound triggered by the grand reopening, alongside severe shortages in inputs, labor and final goods. The surge in WCR already observed in most developed economies will ramp up in 2021, while WCR would remain well under control in a few emerging countries, notably in China (-6 days). In both the US and the Eurozone, we expect WCR to rise by +4 days.
      • While all sectors will see a rise in WCR, consumer goods sectors could see the biggest jump. Last year was a year of divergence. We expect many global sector WCR levels to resynchronize on the upside in 2021, with retail (+9 days up to 52 days) and agrifood (+8 days up to 81 days) seeing the largest rises, followed by industrial sectors such as metals (+7 days up to 103 days), transport equipment (+5 days) and machinery (+4 days).
      • Stocks matter: Along with the “just in case” model of inventory management, and the end of “just in time” for most sectors, rebuilding stocks in an environment of supply shortages will be the key driver of the increase in global WCR, notably across Western European countries. In 2020, Days Inventory Outstanding surged by +5 days in North America and by +1 day in Western countries, while the drop in inventories across Emerging Markets made up for the stockpiling in developed economies. In 2021, we expect pent-up demand and the massive restocking policies of Western companies in the midst of global supply-chain disruptions to weigh notably on their WCR levels. However, in 2022, reduced supply bottlenecks should mitigate the soaring inventory fallout on developed countries’ WCR.
      • State support matters, too: The additional WCR needs represent less than 20% of non-financial corporates’ net cash positions in the Eurozone. However, total deposits of non-financial corporates cover at best 30% of total debt, with France the most vulnerable. Our estimations for the Eurozone show that NFCs’ net cash positions (deposits – new loans up to EUR1mn) increased by EUR547bn in 2020, almost three times more compared to 2019. This compares to EUR102bn of expected additional WCR needed to be financed in 2021, i.e. 17% of 2020 net cash positions. Since the end of 2020, net cash positions have continued to increase in the Eurozone (EUR38bn as of May 2021), with Germany (+EUR18bn) and Italy (+EUR7bn) on top of the list, while in France net cash positions fell by -EUR9bn. However, if the grace periods on state-guaranteed loans are not extended beyond 2021, cash buffers will decrease as total deposits on non-financial corporates cover 30% of total debts at best, with only 23% in France, one of the lowest ratios.

A glance at the change in Working Capital Requirements in 2020 for 36 countries reveals a divide between Advanced Economies and Emerging Markets for the very first time. The WCR level in the West increased (+5 days in North America and +1 day across Western Europe) while it dropped in regions such as Latin America (-3 days), Eastern Europe (-2 days) and APAC (-1 day). Inventory management explains most of this diverging trend (see Appendix).

In EMs, total inventory levels were minimally impacted as demand for goods picked up and has remained strong since the summer of 2020. In contrast, the more severe lockdowns in the US and EU pushed companies into a “forced” stockpiling mode. France, Denmark and Spain, for example, saw their inventory outstanding level surge by +5 days, +7 days and +10 days, respectively, last year. The very accommodating management of payment terms between customers and suppliers fortunately tempered these increases in inventories in some Eurozone countries. France, for example, succeeded in seeing its WCR drop by -2 days over the year, thanks to longer payment terms to suppliers (+6 days) in relation to shorter payments from customers (-1 day).

Massive stockpiling always weighs on WCR levels and cash balances accordingly. However, it is not always a bad thing: it can pay off if it arises from companies’ expectations about future demand growth, to be sure of being able to cater to clients’ orders on time after the crisis period. Conversely, if stockpiling results from an inability to deplete current inventories fast enough, it usually brings on cash shortages for the company, which could end up going bust in the worst case. The different levels of change in WCR from one sector to the other also depend on where they are located in the global supply chain scale in regards to the final consumer. The more a sector is capital-intensive, the more it undergoes a significant WCR rise as any supply disruptions are more expensive when a plant has to temporarily stop production due to a lack of inputs.

2020 saw a surge in WCR across industrial sectors (see Figure 1): +13 days for metals to 95 days, +9 days to 117 days for machinery, +4 days to 84 days for paper and +3 days to 87 days for automotive. These sectors were forced into stockpiling during lockdowns instead of shutting down their plants because of how high closure costs usually are for capital-intensive activities. Overall, metals and machinery were the two losers in regards to last year’s changes in WCR: The Covid-19 crisis has highlighted how inflexible their manufacturing tools are in case of a sudden change in the economic cycle, especially from the inventory point of view. Conversely, the sectors most exposed to the boom of remote work saw their WCR level massively benefit from resilient demand and destocking. This includes electronics ranging from semiconductors to computers (-13 days down to 94 days) as the sector saw skyrocketing demand in 2020. Household equipment saw a fall in WCR of -5 days (down to 92 days), thanks to better-than-expected sales during lockdowns while construction also registered a fall in WCR (-4 days down to 76 days) as the sector cashed in on the shutdowns of new building programs to sell off all inventories left.

The two special cases are pharmaceuticals and automotive, which both saw their respective WCR rise by +3 days, pushing them up to a ten-year record high: 106 days of turnover for the former and 87 days of turnover for the latter. In spite of selling its medicines through drug stores, the pharmaceuticals sector unfortunately bears a very high level of WCR because drug makers usually deal with public hospitals and social security programs with very long payment terms. Conversely, pharmaceuticals has always generated a high level of cash flow so that it can easily support longer payment terms. The high WCR in the automotive sector has more to do with car dealers closely linked to carmakers by the fact that they share the same brand and usually support the funding of the largest part of car inventories.

WCR, just like Days Sales Outstanding (DSOs), tend to increase both in recession and recovery times. In Figure 2, we try to graph the effect that unprecedented liquidity support measures by governments have had – and continue to have – on compressing WCR variations. Initially designed to avoid hysteresis effects (bankruptcies and unemployment), and unlike the 2008-09 crisis, the Covid-19 crisis response has been very much focused on avoiding liquidity gaps and preserving B2B flows and credit. Using IMF data on liquidity support measures (state-guaranteed loans, moratoria on debt, subsidies) and our own WCR calculations (2021 forecasts explained hereafter), we see the lifeline from governments to help suppliers (the invisible bank) continue to finance their clients. In Europe, for instance, the WCR change has been quite limited, alongside very generous liquidity bridges. Also note that initial conditions (WCR levels, structure of the economy), as well as varying intensities of the crisis or recovery, certainly explain specific country developments (Spain and China for e.g.) In large Emerging Markets, we see that liquidity gaps may have been only partially bridged and that corporates will be faced with binding financing constraints as they return to pre-crisis activity.

Figure 1: Global sector WCR in 2020, in number of days (worldwide average)
Sources: Bloomberg, Euler Hermes, Allianz Research


Figure 3 summarizes the results of our WCR forecasts in 2021 for a few Western countries. France clearly appears to be the weak link in our sample as the country whose cash needs are likely to be the highest in order to finance the additional WCR of EUR31bn. Germany and Spain follow, with EUR17bn of additional WCR each, albeit a difference in level (EUR383bn for Germany and EUR109bn for Spain). The Netherlands’ additional WCR of EUR15bn expected in 2021 has to be monitored because this country was previously known for keeping its WCR low. Positioned as a big European platform country for international trade, it is no doubt paying more attention to enough restocking to avoid any fallout of supply-chain disruptions on its WCR. With its additional WCR of EUR153bn expected for the ongoing year, the US accounts for a third of the global additional WCR of EUR453bn needed to be funded in 2021, for a total of more than EUR2600bn.

Figure 3: Breakdown and 2021 forecasts of WCR amounts (EUR bn)

In 2021, nearly every country will see an increase in WCR levels, but the rise will be more significant across the northern hemisphere, given the dynamism of demand in the Eurozone and its massive restocking policies against very low levels of inventories (see Figure 4). Hence, we expect an increase of +4 days on average in WCR across Europe in 2021, ranging from +6 days in France and +7 days in Switzerland to +10 days in Austria and a more worrisome +15 days in the Netherlands. For the US, we expect a rise of +4 days in 2021.

Similarly, when looking at sectors, the rise of WCR is likely to affect all 18 that we monitor, in line with the return to growth prompted by the grand reopening and massive vaccination campaigns, which will improve demand prospects. Hence, we expect WCR to resynchronize on the upside in 2021 at a global level, with the largest increases seen in sectors linked to final consumer goods or closely related to them. Yet, sectors considered as strongly industrial should also see their WCR rise in 2021, such as metals, pharmaceuticals, transport equipment and machinery due to surging commodity prices, which will raise their production costs.

Figure 4 Inventories by sector
2021 WCR forecasts by sector (number of days)
Global demand by sector (new orders + backlogs of work)

Which sectors are the ones to watch? Agrifood (+8 days up to 81 days), retail (+9 days up to 52 days), transport (+ 4 days up to 32 days) and household equipment (+5 days to 97 days). We also expect large rises in WCR for metals (+7 days up to 103 days), pharmaceuticals (+5 days), transport equipment (+5 days) and machinery (+4 days). Last year, the transport equipment (aeronautics) sector benefited from the large destocking of Boeing’s 737 Max planes since these were allowed to fly again from the last quarter of 2020.

The WCR levels for electronics (+1 day), energy O&G (+2 days) and telecom (+0 days) are expected to remain around their long-term historical levels. Their WCR are better suited to withstand any upward pressures despite the acceleration of the recovery around the world. Now more than ever they have become instrumental to the new industrial background taking shape through global digitalization, which puts them in a strong position to set payment terms for both customers and suppliers.

Our WCR forecasts highlight a ten-year high level in 2021 for some sectors, notably agrifood (at 81 days), retail (52 days), pharmaceuticals (111 days), automotive (92 days) and machinery (121 days). These record levels could put companies at risk if they are denied additional credit lines from banks when they need to finance their operating cycle on a rise.

Furthermore, agrifood and retail are two specific sectors strongly destabilized by the booming remote work and e-commerce models, respectively. Not only has e-commerce prevailed over brick-and-mortar retail throughout the world, but also it is faster than before the Covid-19 crisis. Yet, meeting customers’ demands online usually requires e-commerce players to bear a higher level of stocks than retail outlets. It is all the more required now that consumption patterns have shifted towards durable goods, and government income support strengthened demand, while transportation services were limited. The conjunction of booming demand for consumer durables from Asia and supply-side bottlenecks created by sanitary restrictions in ports and terminals have kept shipping costs elevated for several months and made it all the more important to keep high inventories in the West.

However, stockpiling can also result from an inability to deplete current inventories fast enough. As a result, it can usually bring on cash shortages that could even push a company to go bust in the worst case. If replenishing current inventories, particularly in the northern hemisphere, is fueling the rise in WCR globally, changes in payment terms granted to clients should add to this upswing over 2021. This is because a relaxation in payment terms is usually an easy way of getting back market shares that could have been definitively lost by the supply disruptions that occurred last year due to the pandemic.


In the Eurozone, companies’ available cash surpluses generated by massive state support policies (notably direct liquidity support and state-guaranteed loans) appear to be significantly higher than the looming additional amounts of WCR.

Our estimations for the Eurozone show that the net cash positions (deposits – new loans up to EUR1mn) of non-financial corporates increased by EUR547bn in 2020, almost three times more compared to 2019. This compares to EUR102bn of expected additional WCR needed to be financed in 2021, i.e. 17% of the 2020 net cash positions. Since the end of 2020, net cash positions have continued to increase in the Eurozone (EUR38bn as of May 2021), with Germany (+EUR18bn) and Italy (+EUR7bn), on top of the list, while in France net cash positions fell by –EUR9bn, which suggests non-financial corporates have started to use their deposits in addition to new loans for operating activities (see Figure 6). German companies benefit from half of the French amount of cash surpluses stemming from public support policies back in 2020 (EUR93bn against EUR197bn in France). The positive point is that the first five months of 2021 show a further rise in cash generation of EUR18bn, which will fully cover the additional WCR expected in 2021. This stems from either additional public support programs or German companies’ profitability generating positive cash flows again since the beginning of the year alongside recovering export flows.

Figure 7 Available cash positions in 2020

While reassuring, it is important to bear in mind that these excess net cash positions are also needed for the repayment of all other debts. Therefore, this cash cushion might evaporate much quicker than expected, notably if the grace periods on state-guaranteed loans are not prolonged beyond the end of 2021 and companies need to start reimbursing their debt. Looking at the share of total coverage of the stock of loans & debt securities by total non-financial corporates’ deposits, France and Belgium appear to be most vulnerable despite the high levels of available cash. Indeed, total deposits cover 23% of total stock of total debt against around 30% in Germany and Italy (see Figure 8).

Fig 8 Share of coverage of total stock of loans and debt securities

About Securitas

Since 2004, Securitas Global Risk Solutions (“Securitas”) has helped clients worldwide develop credit and political risk transfer solutions that provides value on numerous levels.  As an independent trade credit and political risk insurance brokerage, Securitas is focused on developing comprehensive solutions that meet the needs of clients, ensuring complete understanding of policy wording and delivering excellent responsive service.
Recommended News

Let’s Get in Touch

Office

900 West Valley Road Suite 701, Wayne, PA 19087

Call Us

484-595-0100

The Looming Corporate Debt Bubble

The Looming Corporate Debt Bubble

As we exit the COVID-19 pandemic, the economy appears to be aggressively recovering, fueled by pent-up consumer demand, low interest rates and cash from government stimulus programs. First quarter GDP grew at 6.4%. The Biden Administration just announced a $6 trillion budget, and currently negotiating with Congress for an infrastructure bill which will add another $1 – $2 trillion into the economy over the next several years. While largely positive, this combination has raised concerns about inflation as the prices of commodities, residential real estate, and basic food staples, transportation and travel are increasing. The Consumer Price Index rose 4.2% in April, the largest increase in twelve years.

Due to historically low interest rates, investors seeking higher yields are pouring cash into equities, real estate and alternative investments, such as cryptocurrencies, raising asset bubble concerns. The S&P 500 trailing twelve months (TTM) PE ratio is 31.36 vs. the thirty year average – 23.32. The median existing home price in April was $314,600, 19% year over year increase. Even with recent correction the crypto-currency market is now roughly $1.5 trillion, up nearly 600% from a year ago.

Less widely discussed however is the increased debt levels that corporations have taken on over the last ten years.

According to the Federal Reserve and Securities Industry and Financial Markets Association, large U.S. companies now face the highest levels of debt on record – more than $10.5 trillion. This figure doesn’t include small and middle market company debt estimated to be an additional $5 trillion.

Nonfinancial Corporate Business; Debt Securities

Source:  Federal Reserve Economic Data| FRED| Federal Reserve Bank of St. Louis 

While the coronavirus pandemic contributed to increased borrowing levels (nonfinancial corporate debt outstanding has grown by $1 trillion in two years), because of historically low interest rates, companies have been increasingly accessing cash through the debt markets since 2008 economic crisis.


Ten-year treasury yield:

10 Year Treasury Bond Yield

Source: Federal Reserve of the United States

Low interest rates have encouraged companies to borrow, but instead of funding business investment, in many cases the money was used for share buybacks to bolster share prices. According to JPMorgan Chase (Harvard Business Review, Why Stock Buybacks Are Dangerous for the Economy, Jan 2020) roughly 30% of stock buybacks in 2016 & 2017 were funded by corporate bonds. The International Monetary Funds’s Global Financial Stability Report, issued in October 2019 highlights “debt-funded payouts” as a form of financial risk-taking by U.S companies that “can considerably weaken a firm’s credit quality”. The authors conclude that “when companies do these buybacks, they deprive themselves of the liquidity that might help them cope when sales and profits decline in an economic downturn.”

This has left many companies with less flexibility to weather interest rate increases, or an economic contraction.

Non-financial corporate debt now stands at 40% of GDP:

Corporate Debt as % of GDPSource: Informa Financial Intelligence


Non-Financial Companies with Long-Term debt:

Nonfinancial Companies' Long-Term Debt

Source: “HowMuch.net, a financial literacy website”

The economic growth forecast for the second quarter and remainder of 2021 are positive. For federal budgeting purposes, the Congressional Budget Office forecasts 2021 real GDP growth rate at 5.6%. The highest since 1984 when the GDP annual growth was 7.24%.

Given the increased liquidity and consumer demand, the Federal Reserve will have the difficult task of managing interest rates to reign in inflationary pressures. Higher interest rates could have the dual impact of increased debt service levels and slowing the economy, both of which would negatively impact a highly leverage business.

As the saying goes “Everything thing is fine, until it’s not”. Companies will have to continue to diligently monitor credit even as the economy improves. Trade credit insurance and “Put” option contracts are two tools to assist financial executives evaluate credit risk and protect their balance sheet.

Credit Insurance

Trade credit insurance can be an integral part of a comprehensive credit evaluation and risk management strategy. Credit insurance protects the seller from buyer nonpayment due to insolvency or slow-pay. Credit insurers maintain extensive credit databases and actively capture, update and monitor debtor credit information. They often provide early notification if a debtor’s credit quality deteriorates, or financial performance declines. This information helps credit management professionals determine if, or how much, credit can safely be extended to a buyer.

“Put” Option contract

If a debtor is uninsurable (debt is rated CCC+ or lower), a Put option contract might be available. Put option contracts are non-cancelable and protect the seller if the debtor files for bankruptcy during the contract term. The contract terms are generally based on debtor credit quality, tenor and amount. Put option contracts have been limited to debtors with publicly traded debt. However, with recent changes in the Put option market, they can now be written on private debtors as well if financials are available.

Since 2004, Securitas Global Risk Solutions has helped clients develop credit and political risk solutions. As independent trade credit and political risk specialists, we are focused on developing comprehensive solutions that meet the needs of our clients. Please feel free to call us with any questions, or if we can be of any assistance.

Notes:

William Lazonick, Mustafa Erdem Sakinc, and Matt Hopkins. “Why Stock Buybacks Are Dangerous for the Economy.” Harvard Business Review, Jan 7, 2020, pages 2-3

HowMuch.net. a financial literacy website

Federal Reserve Bank of St. Louis

Congressional Budget Office, Nonpartisan Analysis for the U.S. Congress

Let’s Get in Touch:

Telephone: 484-595-0100

Fax: 484-582-0111

Recommended News

Let’s Get in Touch

Office

900 West Valley Road Suite 701, Wayne, PA 19087

Call Us

484-595-0100